I ran a Commodity Trading Advisor (“CTA”) many years ago and an interesting output of our trading models were the stop loss levels. It turns out that most CTAs are trend followers, looking to exploit momentum in the commodity and financial future markets. As such, there’s a high degree of overlap between most CTAs performance and entry/exit timings.
Most CTAs will run a number of models & parametrizations on a given market. For instance, they could have 5 different models to measure momentum with 6 different parametrizations each to account for different time frames. As such, a total of 30 different signals could be generated for each market. The aggregated position will be the sum of the 30 different signals.
It is particularly interesting when a market became offsides. In other words, a vast majority of the signals are long or short. This usually means the CTA/trend following community is all in. Then, when these markets reverse you know there could be a vast amount of stop loss selling or short covering, as well as any potential new signals to go short or go long. Quite often, these levels are good predictors of heightened market volatility. As such, I used to always keep an eye on them to see which markets had the most potential for an explosive move.
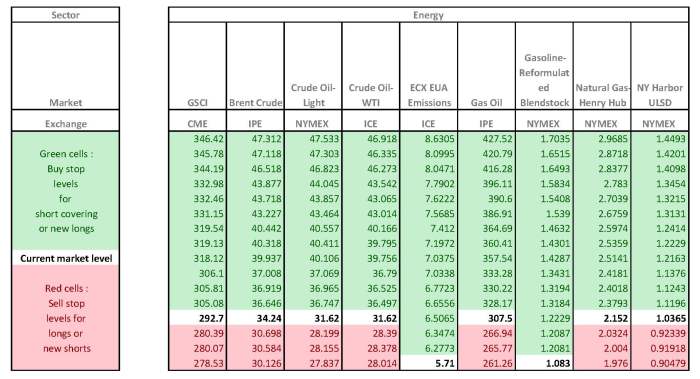
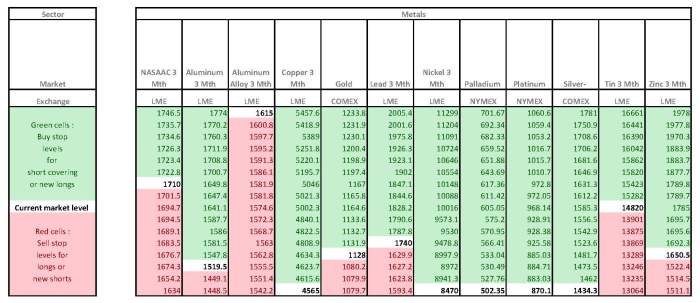
In the table below I’ve listed out these stop loss levels for various energy and metal futures markets. The green cells highlight the levels of stop loss buying. This would either be short covering or entering new longs. The red cells highlight the levels of stop loss selling. Once again, this could be long liquidation or new shorts. The white cells in bold provide current market levels.
The link below is to a spreasheet that contains the levels for a bunch of other markets – agriculture products, equity products, fixed income products, soft commodities, etc.
marketlevels_0201
