CTA market entry/exit levels: marketlevels_0520
Month: May 2016
US Bank Holding Companies & Commodities (cont’d)
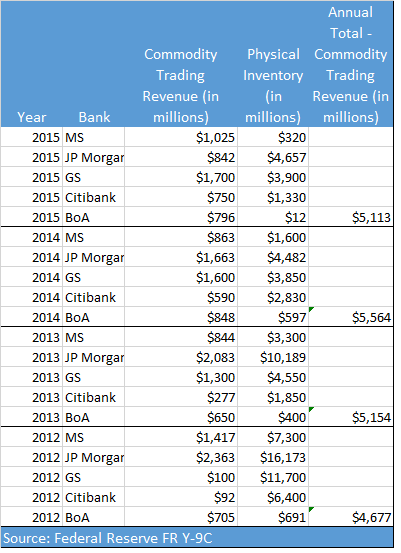
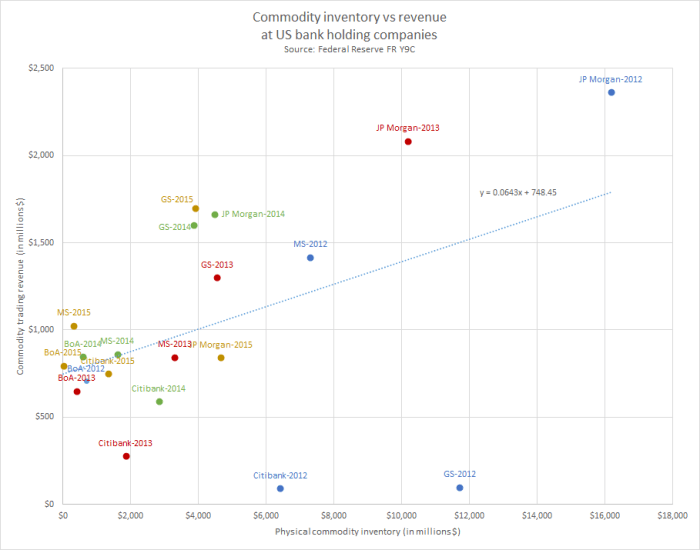
Here’s a table and graph of the past several years of commodity revenues at various US bank holding companies. Here are my takeaways….
- The overall market size has not dramatically changed over the years notwithstanding the media attention on waning commodity revenues at banks;
- The balance sheet utilization for physical inventory has shrunk considerably;
- JP Morgan’s commodity revenues have been on a steady downtrend; Citi on a steady uptrend; GS consistent other than a shocker in 2012 and BoA is a flat out surprise (did they include their lending portfolio?);
- It would be interesting to benchmark these figures against headcount and VaR.
CTA model update – May 13, 2016
A friend reminded me that it’s been far too long since I’ve provided an update on the CTA model levels. Many apologies for the long hiatus. A number of initiatives distracted me over the past few months. I should be posting more regularly now.
CTA Market entry/exit levels: marketlevels_0513
