Sometimes we search for individual investments when great investors are being ignored right at our doorsteps. Berkshire Hathaway is the granddaddy of them all but there are quite a few mini-Berkshires. In North America, most value investors are familiar with Leucadia, Loews, Danaher, Platform Specialty Products but interestingly enough, there are a number of publicly listed European holding companies that wealthy European families use for their investments.
Pargesa Holdings (Belgium — Baron Albert Frere; Canada — Paul Desmarais)
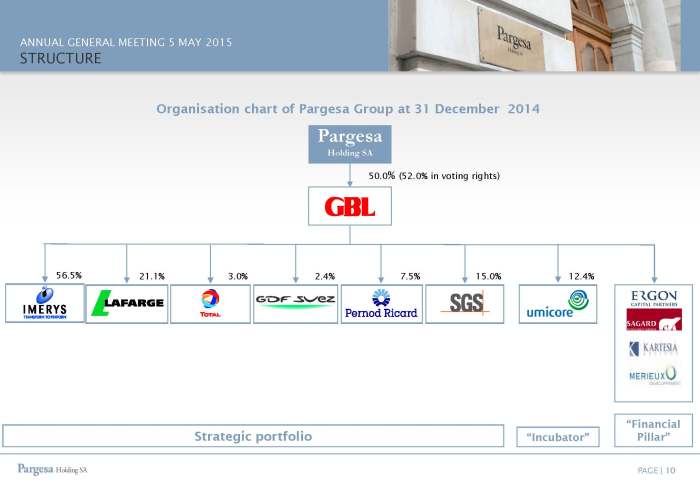
Pargesa is a holding company formed by Albert Frere and Paul Desmarais in 1981. The company has a unique background in that it was formed to avoid the nationalization of Paribas by the newly elected socialist president Francois Mitterand. The holdings are displayed in the chart below (see 2015 Pargesa Annual General Meeting ).
Interesting enough, the holding company has traded at a discount to NAV since the mid 2000s (see GBL stock price vs NAV ).
Pargesa, GBL & Power Corp of Canada
Billionaire Frere
Wendel (France — Wendel family)
Founded in the France in 1704, the Wendel Group developed its business over more than 300 years in diverse industrial sectors, mainly steelmaking. At the end of the 1970s, the French government nationalized all of their steel production activities. Wendel, a pioneer in private equity, then turned its focus to long-term investing.
History and background on the family & company can be found on their website.
Wendel Group history
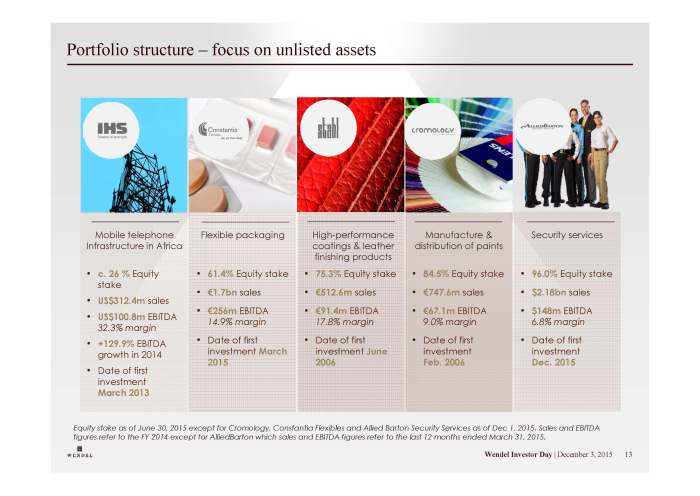
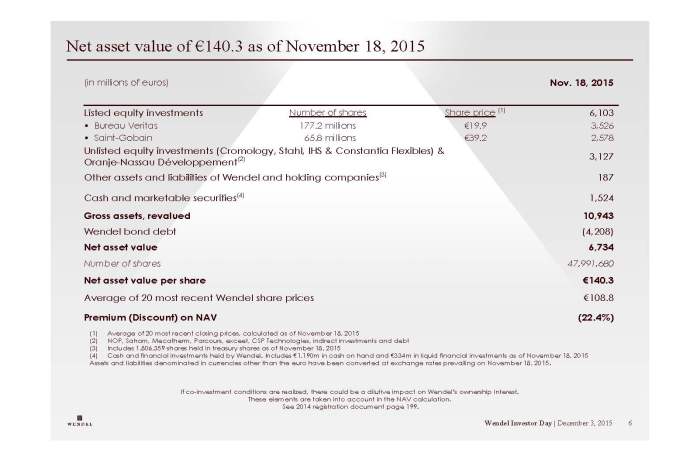
The holdings are displayed in the chart below ( see 2015 Wendel Group Investor Day ).
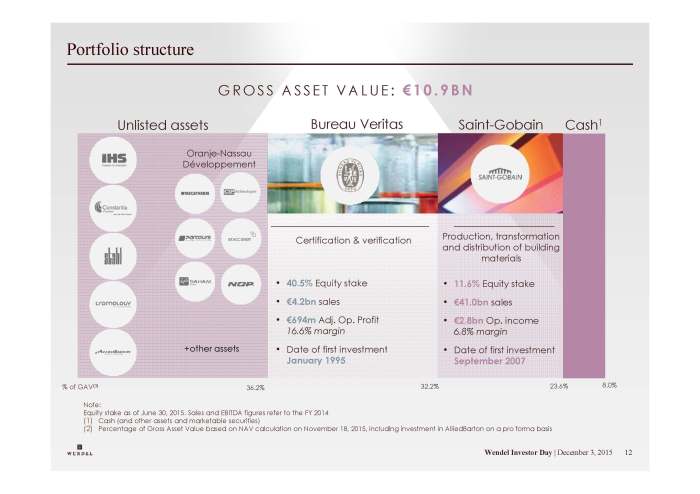 (Interesting side note for UK residents – Saint Gobain is the parent company of the large UK building supplier Jewson).
Unlike several other European family holding companies, the Wendel Group has a significant allocation to unlisted (private) companies.
Similar to Pargesa, the Wendel Group trades at a discount to NAV (see Wendel Group – stock vs NAV ).
 Exor (Italy — Agnelli family)
Exor is a holding company controlled by the Agnelli family that owns interests in the companies in the slide below.
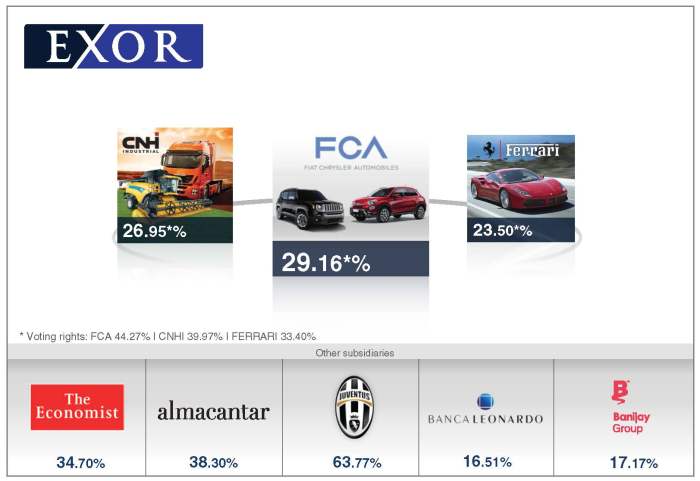
John Elkann, the Chairman and CEO, appears to be building an Italian Berkshire Hathaway with his investing style. He even pens a genuine letter to his shareholders 2014 Letter to shareholders
Once again, the holding company trades at a discount to NAV. I believe the discount is now circa 15% using NAV data as of Sep 2015. Here’s a slide of the stock & NAV performance as of May 2015 (See May 2015 Investor Call ).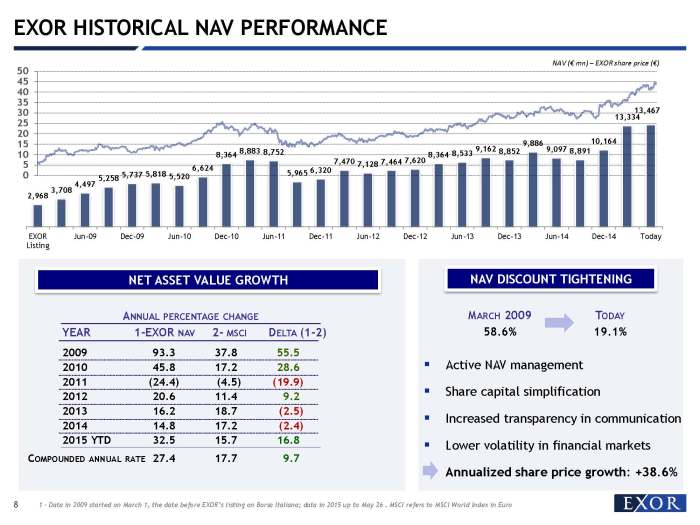
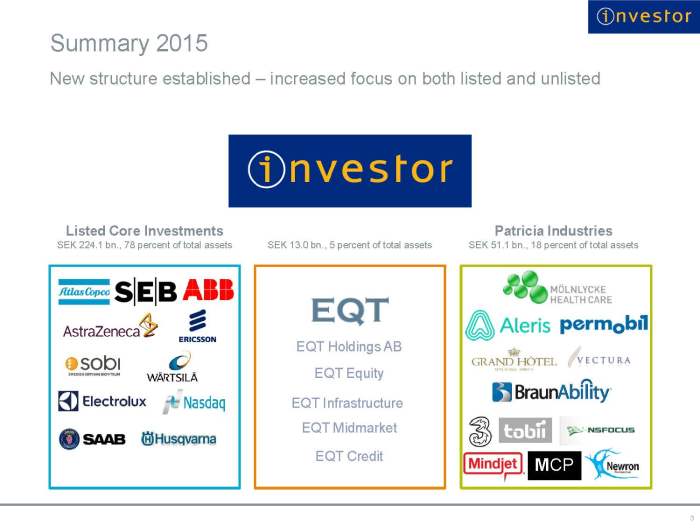
Investor AB (Sweden — Wallenberg family )
Founded by the Wallenberg family a hundred years ago, Investor is the leading owner of high quality Nordic-based international companies. Investor was founded 1916 and spun out of Stockholms Enskilda Bank. From 1916 to the early 1970s, Investor was part of Stockholms Enskilda Bank, which had been managed by the Wallenberg family ever since the bank was founded in 1856. Later, Investor gradually developed into a holding company with independent operations. .
Today, they have diverse holdings in leading Nordic companies ( 2015 Investor AB presentation ). In many cases they are the largest shareholder of the listed company.
2015 Year end report
Wallenberg family
Investor AB & Wallenberg family
Once again this trades at a discount to NAV as well. Some people may argue that the dual share class structure with Investor AB is the source for some of the discount.
Summary
One could argue that investing in such holding companies is a lazy way to invest but I have no problem conceding that these firms excel at creating shareholder value over generations. Whether or not one invests, one can certainly learn something from watching and analyzing their investment approach.