It turns out that US bank holding companies (“BHC”) are required to file Form FR Y-9C with the Federal Reserve. The information collected is used by the regulators to assess and monitor the financial condition of holding company organizations, which may include parent, bank, and nonbank entities. It is primarily an analytical tool used to monitor financial institutions between on-site inspections. The following link is to a list of the largest US bank holding companies. Follow each bank’s link and select the form FR Y-9C to see the data for yourself.
Federal Reserve Form FR Y-9C
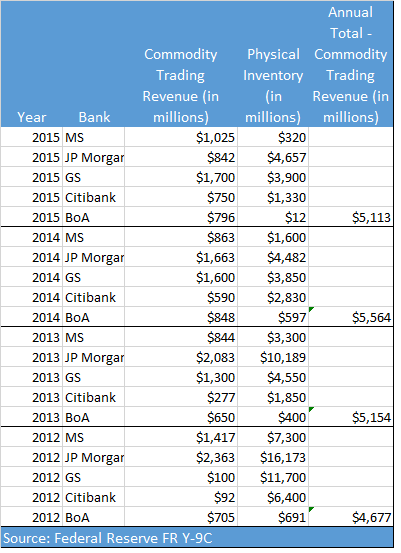
There is commodity level data for the US BHCs in this form. More specifically, it has the following data for some active commodity banks as of December 31, 2015. All data in thousands US$
| Bank |
Trading revenue -from cash instruments and derivative instruments
(thousands US$) |
Item 9a Gross fair value of commodity contracts
(thousands US$) |
Gross fair value of physical commodities held in inventory
(thousands US$) |
| JP Morgan |
$842,000 |
$23,713,000 |
$4,657,000 |
| Bank of America |
796,000 |
1,697,500 |
11,800 |
| Wells Fargo |
92,000 |
5,519,000 |
– |
| Citibank |
750,000 |
18,010,000 |
1,330,000 |
| Goldman Sachs |
1,687,000 |
20,674,000 |
3,935,000 |
| Morgan Stanley |
1,026,000 |
17,152,000 |
321,000 |
JP Morgan claim to have sold their physical business yet retain a $4.6 billion exposure to physical commodities held in inventory. Perhaps their putative exit of physical commodities was only the transportation/movement of them?